Configuring a web load test by hand is one of those tasks that’s just interesting enough to require expertise and just tedious enough to make you resent having it. After 25 years of tediously pouring through HTTP headers, I decided to teach an AI to do the work instead. Then I built a second system to handle the part nobody enjoys: staring at load test metrics for hours and condensing them into a client report that will almost certainly be read no further than the executive summary.
Web Performance Load Tester is a 550,000-line Java application that has been in continuous development for over 25 years. (I wrote about modernizing the codebase separately.) For version 7.0, I built two agentic AI systems that change how users interact with the product.
Here’s the whole system at a glance. Everything in color is new in 7.0: the embedded agent, the MCP server and its 97 tools, and the cloud analytics dashboard. The gray box is the 25-year-old application it all wraps around.

The Test Case Configuration Agent
Here’s the problem. You record a browser session: login, click around, do some work, log out. Every HTTP request gets captured. Now you need to replay that session under load, with hundreds of simulated users.
But your recording is full of values that can’t be replayed as-is. Session IDs. CSRF tokens. Authentication cookies. Timestamps baked into URLs. Every one of these needs to be identified, traced back to where it first appeared in the server’s responses, and wired up so that each simulated user gets its own unique value. Miss one, and the replay fails. Miss the subtle one, the one buried in a JSON response three requests deep, and the replay fails in a way that looks like a server error, not a configuration error.
But doesn’t Load Tester already handle this automatically?
Mostly, yes. Automatic State Management (ASM) is a rule-based engine that handles the common cases: cookies, form fields, hidden fields, query parameters, authentication headers, and framework-specific patterns for OAuth2, JWT, React, Angular, and GraphQL. ASM scans tens of thousands of fields and gets most of them right.
But “most” leaves a lot of room for frustration. There will always be edge cases. Proprietary patterns. Custom implementations. A homegrown token format that no rule anticipated. Customers don’t call us when things go right; they call us when they run into another complicated scenario no one saw coming. An experienced tester might still spend hours (real, could-have-been-doing-something-more-interesting hours) hunting down correlation issues on a complex web application. I wanted an AI assistant that could build on ASM’s foundation and handle the rest through conversation.
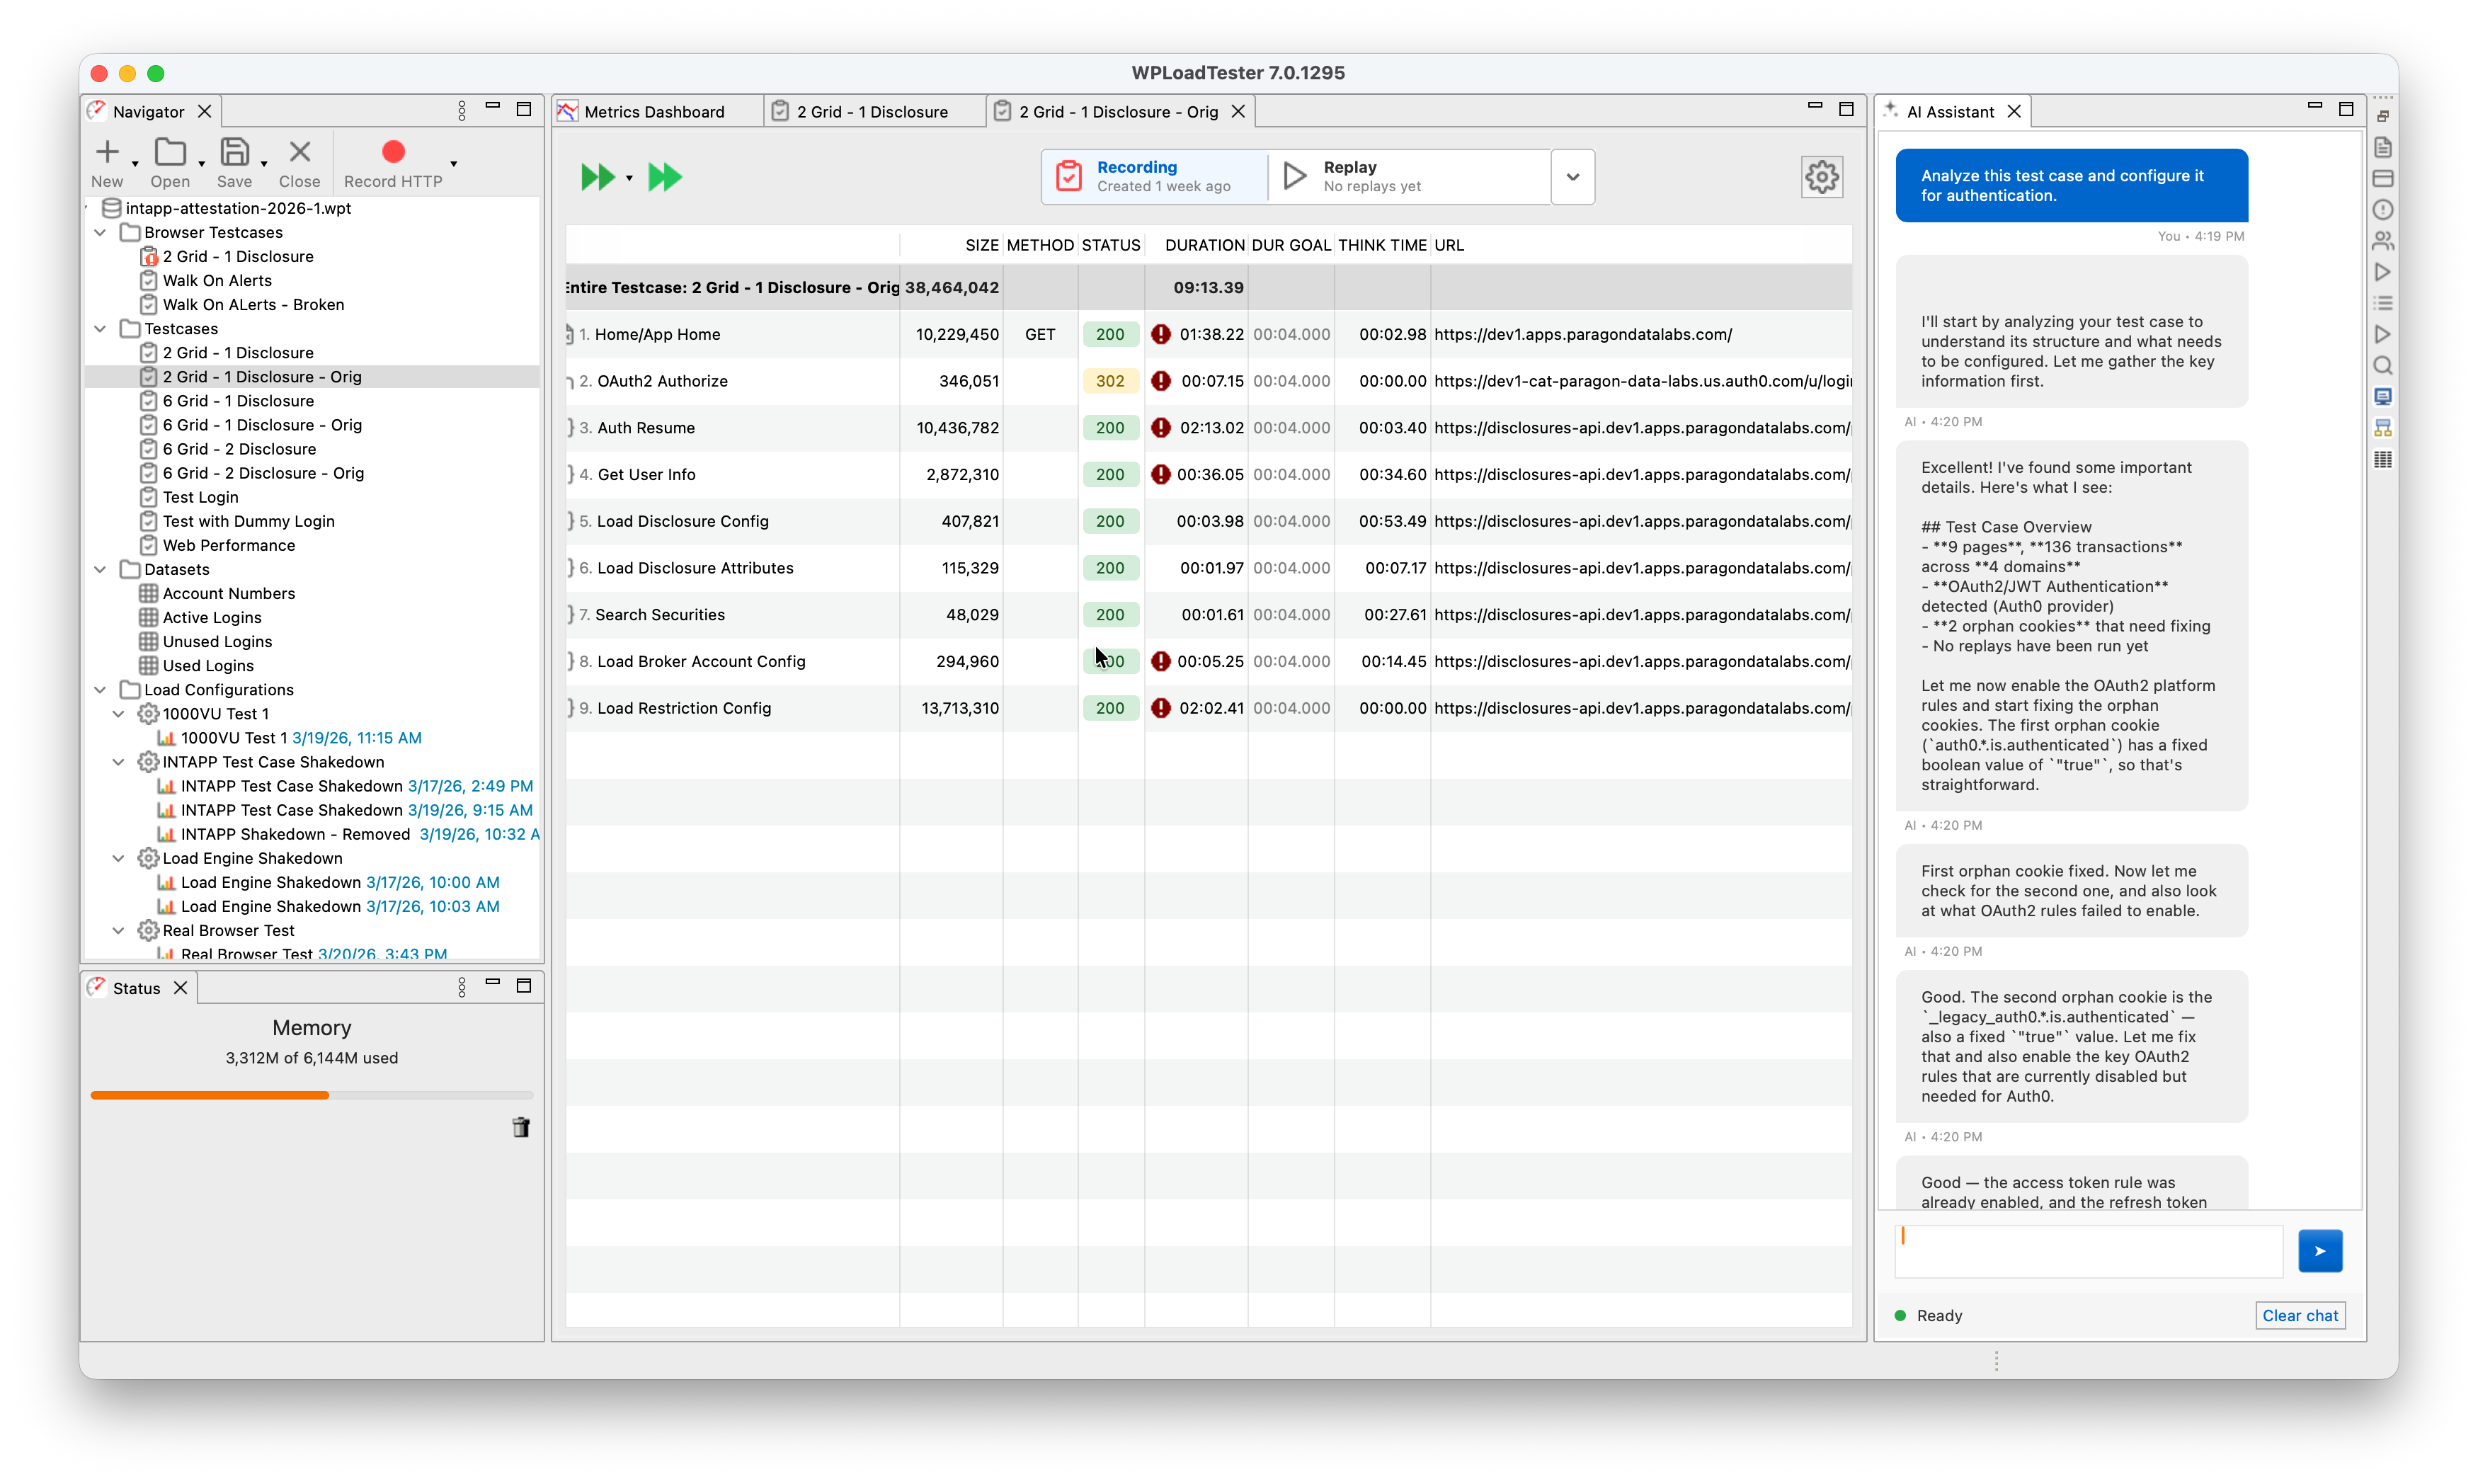
Here’s what that looks like in practice. The user typed one sentence: “Analyze this test case and configure it for authentication.” The agent analyzed the recording (9 pages, 136 transactions across 4 domains), detected OAuth2/JWT authentication with Auth0 as the identity provider, found 2 orphan cookies that needed fixing, and started enabling the right platform detection rules. The user didn’t specify which authentication framework. The user didn’t say “Auth0.” The agent figured it out.
The Three-Stage Router
How does the system know what you’re asking for?

The first thing it does is figure out which stage of work you’re in, and it does this without AI. No language model, no classification, no inference. It just looks at the UI. Load test running? Stage 2: live monitoring. Viewing completed results? Stage 3: analysis. Neither? Stage 1: configuration. I call this the ScenarioRouter, and its job is to prevent the AI from overthinking obvious context.
For Stage 1 (configuration), there’s no classifier. One consolidated prompt with the full configuration and correlation toolkit handles every Stage 1 conversation. An earlier version split Stage 1 across ten scenario prompts (CORRELATION_SETUP, DEBUG_ERRORS, ASM_ANALYSIS, PLATFORM_DETECTION, and so on) with an AI classifier picking between them. The scenario boundaries failed in practice: a “debug errors” conversation would drift into correlation setup within two or three turns, and the classifier kept misrouting the continuation because real workflows don’t respect the taxonomy. Consolidating to a single prompt made the agent more predictable and cut a per-message AI call out of the most common conversation path.
For Stages 2 and 3, the scenario is also deterministic (LIVE_TEST_MONITORING and PERFORMANCE_ANALYSIS respectively), but a classifier still runs to tag the question type: capacity, errors, slowest pages, throughput, summary, or open-ended triage. Direct questions get steered toward the right tool. Open questions trigger what I call the L0-L1-L2 Diagnostic Hierarchy, a structured analysis where the agent works through the results systematically rather than grabbing the first metric it finds. L0 is the entry classifier: it tags the test by error rate, latency, and throughput. L1 routes to one of seven symptom domains: timeout, http500, gateway, loadbalancer, unavailable, connection, and performance. L2 names a specific signature within a domain, like timeouts coexisting with HTTP 500 errors at the same load level, which is usually one cascading failure rather than two independent problems. L2 is a growing library; the L0 and L1 layers are fully populated, and L2 signatures are being added as we encounter new patterns worth naming. Classification is capped at 50 output tokens (just enough to return a question type), so it costs a fraction of a cent and takes under a second.
An earlier version of this used a separate lightweight model (Claude 3.5 Haiku) for classification and a larger model (Sonnet) for the actual work. In practice, the routing calls use so few tokens that the cost difference was negligible, and the added complexity of managing two models wasn’t worth it. One model, one configuration point.
The user chooses which AI provider and model to use: AWS Bedrock, the Anthropic API directly, or OpenAI. The system routes all calls (classification and conversation) through the same configured provider.
The Loop
The core of the system is a while (true) loop:
|
|
Send the conversation to the configured AI provider. If the model asks to use a tool, execute it, send the result back, and loop. If it responds with text, we’re done.
Every turn runs under a three-counter budget: 30 iterations, 40 tool calls, 200 KB of aggregate tool-result bytes. Hit any cap and the loop stops with a synthetic message asking the user how to proceed. A typical correlation workflow uses 12 to 20 iterations (discover a dynamic value, trace its origin, create a detection rule, test it, adjust, run a replay to verify) and fits comfortably under the caps. An earlier version had no cap at all, on the theory that Claude concludes when it’s done and an arbitrary ceiling would truncate real work. That was fine until a pathological pattern (a confused classifier, a misleading tool result, a cookie that wouldn’t correlate) put the agent in a loop that chewed through thousands of tokens before anyone noticed. Three caps catch three different pathologies. Iterations catch “poll forever.” Tool calls catch “emit three tool uses per iteration,” which sneaks past the iteration counter. Bytes catch “each tool returns 20 KB and we blow the context window before we blow the iteration count.”
The loop also manages context proactively. At 150,000 tokens (75% of the 200K window) it warns the user. At 180,000, it truncates older conversation history and validates the result before sending. Truncation is harder than it looks. A tool_use block from an assistant message has to stay paired with its tool_result block in the following user message. Split a pair and the provider rejects the whole conversation with a schema error. The validator walks the truncated conversation end to end, confirms every tool_use has its matching tool_result (and vice versa), and surfaces a plain-English “please clear chat” message rather than a provider stack trace if anything is wrong. 200,000 tokens fills up fast when every tool result is a few hundred lines of HTTP headers and response bodies.
Sensitive Tools Require Authorization
A short list of tools will change real state: run_replay, start_load_test, stop_load_test, halt_load_test, delete_pages, strip_static_resources, clear_replays, and copy_pages_from_testcase. Any call to one of these gets intercepted before execution. The tool returns a synthetic requires_user_authorization result, the loop surfaces the request, and nothing happens until the user replies with a positive confirmation (yes, ok, proceed, go ahead). Ambiguous replies fail closed and trigger a re-ask. Negative replies clear the pending request.
This looks like bureaucracy until you watch the alternative. A creative but wrong interpretation of a conversation can start a load test, delete pages, or clear hours of replay evidence if nothing stands between the model’s tool call and the running system. The authorization gate costs one round trip per sensitive call. The alternative costs hours of re-recording.
97 Tools
The agent has access to 97 tools organized into categories:
| Category | Tools | Purpose |
|---|---|---|
| Transaction Analysis | 4 | Summaries, replay errors, response content, apply detection rule |
| URL & Test-Case Correlation | 4 | Find dynamic value origins, URL substitutions, request details, whole-test inventory |
| Detection Rules | 4 | List, enable rules; platform detection |
| Extractors | 9 | Boundary, regex, scripted, PKCE, JSON array collector, delete |
| Field & Header Datasources | 5 | Configure how fields and headers get dynamic values |
| ASM & Replay | 4 | Run ASM, trigger replays, check status |
| Datasets | 3 | Manage test data (CSV files, columns, samples) |
| Page Properties | 5 | Titles, think times, duration/failure/status goals |
| Testcase Management | 5 | List, backup, delete, copy pages, unconfigured fields |
| Load Test Execution | 7 | Create/list profiles, testcases, start/stop/halt tests |
| Live Monitoring & Results | 20 | Real-time and post-test metrics, capacity, errors, trends, slowest pages |
| Analytical Tools | 4 | Errors by status, cumulative impact, correlations, degradation points |
| UI Navigation | 3 | Select transactions, open dialogs |
| Cookie Handling | 3 | Detect and fix orphan JavaScript cookies |
| Website Analysis | 2 | Find renamed resources, strip static content |
| Plan Persistence | 2 | Save/load markdown todo lists |
| Recipes & Triage | 2 | On-demand specialty knowledge (PKCE, Rhino, etc.) |
| Diagnostics & Filter Bindings | 5 | Variable lineage, filter bindings, replay cleanup, readiness check |
| Validation & HTTP Reference | 2 | Expected status codes, status-code lookup |
| Report Generation | 1 | Trigger AI performance report |
| Manual Search (RAG) | 1 | Full-text search of the user manual |
| Workflow & Tool-Palette Meta | 2 | Stage orientation snapshot, load a different tool palette |

Every one of them runs in-process: no REST API, no network hop, no serialization. When the model calls find_value_origin, the tool searches every recorded HTTP response in memory. When it calls apply_detection_rule, the tool creates the rule, tests it against the recording, and reports back. The tools talk directly to the ActiveTestCaseProvider class, which holds the live data model. Speed matters because the agent might call 20 tools in a single conversation turn.
Don’t Show the Model All 97 Tools
Having 97 tools is a liability the moment you hand all of them to the model at once. The Berkeley Function Calling Leaderboard, a public benchmark that scores how often a model picks and calls the right function, measures accuracy falling off a cliff as the menu grows: about 43% correct at 4 available tools, down to 2% at 51. At 97 I was well into the territory where the model stops choosing and starts guessing. So I stopped sending the whole catalog. The same deterministic stage signal that selects the prompt also selects a tool palette: Stage 1 gets the configuration and correlation set (around 60 tools), Stage 2 gets execution and live monitoring (around 19), Stage 3 gets the analysis set (around 28), and an open report draft narrows it to the half-dozen tools that actually write the report. The pick is a pure function of UI state (PaletteCatalog.select), not another AI call, so it costs nothing and never misroutes for a subtle reason. One palette instead of the full set drops the per-turn tool schema from roughly 40,000 tokens to somewhere between 3,000 and 18,000, but the token savings are the smaller win. The real win is handing the model a menu short enough to read.
What happens when the deterministic pick is wrong, and a Stage 1 question actually needs a Stage 2 tool? One tool rides on every palette: request_tool_palette. When the model decides its current set can’t finish the job, it asks for a different palette, the loop swaps the tool list mid-conversation, and the work continues. The code owns the workflow; the model owns the decision to change lanes. Nothing is permanently hidden, so the scoping buys accuracy without costing capability.
The Actor-Critic Pattern
When the actor AI failed to configure a test case, my first instinct was to tweak the prompts or the agent logic. That produced round after round of prompt changes that did very little. What actually moved the needle was connecting a separate Critic AI through an MCP server and pointing it at the same test case the actor was trying to configure. Asked to diagnose why the actor was getting poor results, the critic kept pointing past the prompt at the real culprit: bad data. The MCP tools were returning information that was technically correct but shaped in ways that made correlation hard for the actor. There were many opportunities to reshape tool output so the AI could find patterns more easily, for example, avoiding time-series data and always correlating metrics by load level. Those data-layer tweaks produced far larger gains in the actor’s ability to configure a test case than any prompt adjustment ever did.
The Report Generation System
The second system solves a different problem. After a load test finishes, someone has to analyze the results and write a report. You know the kind. “The system sustained 500 concurrent users with response times under 2 seconds. At 750 users, response times degraded. The login endpoint was the primary bottleneck.” It follows patterns. It’s the kind of work where you already know what you’re going to say before you look at the data. You just don’t know the numbers yet.
I’ve written about 500 of these reports by hand over the years. They don’t follow a rigid formula. The structure adapts to what the data shows. When Auth0 rate limiting causes 71% of errors, that gets its own deep-dive section. When database write contention is the bottleneck but CPU is only at 35%, the server correlation analysis becomes the headline. The report follows the data.
I tried to replicate that with deterministic code. Rules for CPU divergence detection. Rules for capacity thresholds. Rules for error categorization. It produced correct reports, but they read like data reformatting, not analysis. The rules couldn’t see that the third-slowest endpoint was actually more concerning because its degradation curve started earlier and steeper. They couldn’t notice that error rates cascaded from a single upstream failure through the entire authentication chain. The reports were accurate and boring.
So I threw out the deterministic pipeline and made it agentic.
The Same Loop
The report generator uses the same agentic loop as the test case configuration agent:
|
|
When a user right-clicks a completed test result and selects “Generate AI Performance Report,” the system opens a React-based Report tab and starts this loop with 10 data tools available:
| Tool | What It Returns |
|---|---|
get_test_result_summary |
Test overview, duration, max users, total hits/errors |
get_load_test_metrics_by_user_level |
Per-level metrics (the most important data source) |
get_estimated_capacity |
Pass/fail per load level against configured thresholds |
get_load_test_server_metrics |
CPU/memory/bandwidth by user level, bottleneck diagnosis |
get_load_test_errors |
Error categories with exact message text and counts |
get_load_test_page_metrics |
Per-page performance with user-level breakdown |
get_load_test_http_transactions |
Individual HTTP endpoints with user-level data |
get_load_test_slowest_transactions |
Pages ranked by degradation ratio |
get_test_structure |
Test case → page → transaction hierarchy |
get_load_test_time_series |
Full timeline for the overview chart |
The AI decides which tools to call, in what order, and when it has enough data to write. There’s no checklist. No “you must call all tools before writing.” The AI investigates the data and writes when it’s ready.
An earlier version enforced a rigid tool checklist: all 10 tools had to be called before the AI was allowed to produce text. A “code gate” literally injected “STOP: you have not gathered all required data” if the AI tried to write early. That defeated the entire point. A truly agentic system lets the AI drive the investigation. If the capacity data reveals a clear bottleneck, the AI should be free to dig into that bottleneck with the transaction and error tools rather than mechanically calling every tool in a predetermined order. I ripped out the gate and let the prompt guide the investigation instead.
The Prompt Does the Work
The prompt (stored as a markdown file on S3, updatable without a software release) is where all the domain expertise lives. It describes a recommended workflow (gather core data first, then investigate), defines the analysis window concept (separate normal operation from overload), and specifies the report structure with table formats, status labels, and chart placements.
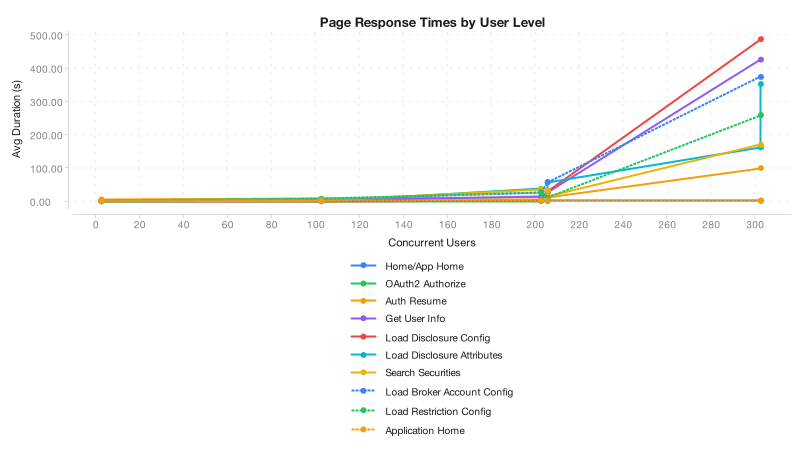
The key design insight: load-level data is the primary analytical lens. When you have 5-10 discrete load levels (100, 200, 300… users), trends and inflection points are immediately visible. Time-series data with thousands of data points is useful for the timeline chart but terrible for analysis. The prompt steers the AI toward per-level comparisons because that’s what produces clear conclusions.
The prompt also includes an anti-hallucination rule: every metric in a table must come from a tool result. If a tool didn’t return a particular metric, the AI notes the gap rather than guessing. This is critical because the report is a client deliverable: a fabricated number is worse than a missing one.
Matching Hand-Written Quality
The generated reports now match the conclusions I reach when writing by hand. Testing against the same load test data, the AI identifies the same capacity ceiling (~100 users), the same CPU divergence pattern (42% CPU while response times explode, not CPU-bound), the same Auth0 authentication cascade as the dominant error source (71% of errors), and the same UPSERT endpoint as the early warning signal. The recommendations overlap: audit connection pools, fix the auth flow, profile the write path, enable memory monitoring, retest at narrower intervals.
Where the AI reports are still weaker: the hand-written reports have richer chart annotations (colored analysis zones, threshold lines), more granular Auth0 flow breakdowns (step-by-step OAuth failure chain), and occasionally sharper prose. But the analytical substance, the conclusions and recommendations that actually matter to the client, is the same.
The Output
The finished report exports as DOCX via Apache POI, with styled tables and 9 chart PNGs generated server-side using XChart: timeline, normal response time, response time by user level, CPU vs. response time, server CPU, bandwidth, slowest transactions, slowest pages, and error distribution. The entire pipeline is Java with no browser dependency for charts.
What Holds It All Together
Both systems rest on a few principles I arrived at the hard way.
The AI reasons. The code computes. Every calculation, every threshold comparison, every data aggregation happens in deterministic code inside the MCP tools. The AI handles investigation, pattern recognition, and explanation. It never does math directly. If you let an AI multiply two numbers, it will get it wrong at the worst possible time. But it’s excellent at looking at a table of per-level metrics and recognizing that CPU at 42% while response times explode means the bottleneck isn’t CPU.
Tools are the contract. All 97 MCP tools serve as the boundary between AI reasoning and application state. Each tool validates its inputs, does one thing, and returns structured results. The AI never touches the raw data model. Small, composable units with clean interfaces.
Build once, use twice. The report generator calls the same tools the interactive assistant uses. The tools get tested through two very different usage patterns, conversational and agentic batch, which keeps them honest.
Retrieval-Augmented Generation is part of the picture, not the whole thing. The triage hierarchy and the recipe system are RAG. When the agent hits an open-ended performance question, get_triage_prompt pulls the diagnostic pathway for that failure pattern from an L0-L1-L2 corpus. When the agent needs specialty knowledge on PKCE flows, Rhino JavaScript syntax, or cookie handling, get_recipe pulls the matching markdown document. Both retrieve pre-authored text from a corpus and inject it into the conversation to ground generation. The lookup is deterministic keying (symptom or topic name) rather than embedding similarity, so the accurate label is keyed or hierarchical RAG, not vector RAG. A third retrieval mechanism grounds documentation answers: search_manual runs a BM25 keyword search over the roughly 2,000 pages of the product manual, which it fetches from the live docs site and indexes in memory at startup. No embeddings, no vector store, just classical full-text ranking, so when a user asks how a feature works the assistant answers from the actual manual rather than from its training data.
The data-fetch tools are not RAG. When the agent calls get_load_test_server_metrics and gets CPU-by-user-level data with a pre-computed bottleneck diagnosis, that’s a query against a running application, not retrieval from a corpus. The tool computes the result from the in-memory data model. A SQL call is not RAG, and a tool call that aggregates live metrics isn’t RAG either, even though both ground the AI’s output in facts the model couldn’t have memorized. The accurate label for the majority of the tool ecosystem is agentic tool use, which is a sibling pattern to RAG rather than a subtype.
Flattening both under one label hides what each one costs to build. RAG needs an indexed corpus, a retrieval strategy, and prompt engineering to keep the model from ignoring the retrieved context. Tool use needs a typed schema, a stable live data model, and discipline about what the tool returns. Different problems, different failure modes. Calling both RAG dilutes the term until it means “the model looked something up.”
Prompts are the domain expertise. The prompt files live on S3 and can be updated without a software release. For report generation, the prompt encodes 500 reports’ worth of structural knowledge: how to define analysis windows, when to create a dedicated deep-dive section for a dominant issue, what status labels to use in tables, and how to separate overload data from normal operation analysis. The Java code just runs the loop; the prompt drives the investigation.
Fail gracefully. If the AI provider is down, the report system produces a data-only report with charts and tables. If the AI provider is unreachable for intent classification, the system falls back to a general-purpose scenario. If a tool call fails, the error goes back to the model as a tool result and it adapts. Nothing crashes. Nothing hangs.
Show the work. The test case agent shows its intermediate thinking as text blocks alongside tool calls. Report generation logs every tool call and result for post-generation review. The user is never staring at a spinner wondering what happened.
The Entire App Is Now an MCP Server
The architecture now runs all 97 tools inside the desktop application and exposes them as a network MCP server. External AI tools (Claude Code, Codex, Claude Desktop, Cursor) can connect to a running Load Tester instance and use the same tools directly. The tool implementations didn’t change. Only the transport layer.
For users more comfortable with CLI agents than a desktop GUI, this changes the interaction model entirely. Claude Code or Codex can connect to the MCP server and access every tool in the application: configure test cases, run load tests, investigate results, generate reports. The in-app report generator uses 10 of the 97 tools through its agentic loop. An external CLI agent gets all 97, plus its own capabilities: file I/O, web search, multi-step reasoning. The best reports I’ve written so far were produced by pointing Claude Code at the dashboard API endpoints and letting it investigate freely. Now any MCP-capable AI client gets that same access, with the same tools that already work.
This also raises an interesting question about the RAG half of the architecture. With context windows expanding to 1M tokens (Claude Opus 4), it’s not clear that carefully curating retrieval to reduce context size actually improves results when the agent has room to hold everything at once. The L0-L1-L2 triage and recipe system were designed to feed the AI only the most relevant information for a given problem. That discipline still matters for cost and latency, but a CLI agent with a million-token window can afford to pull in far more context and still reason effectively. Whether precision retrieval outperforms brute-force context loading in practice is an open question, and one that may keep shifting as context windows grow.
What hasn’t gotten easier is the harder problem underneath all of this: validating the AI’s work. Did the agent correctly configure the test case? Did it identify every dynamic value, or did it miss the subtle one buried three requests deep? Did the generated report deliver an accurate and complete analysis of the results, or did it gloss over a degradation pattern that a human would have caught? Even with AI doing the analysis, building the datasets and evaluation frameworks to answer those questions reliably remains the real bottleneck. The architecture works. Proving that its output is trustworthy, consistently, across the full range of real-world test scenarios, is the harder part.
What Didn’t Work
Not everything went smoothly.
An early attempt routed the AI agent system through AWS: IoT Core via MQTT for transport, Lambda for orchestration, AgentCore for the Python agent. Architecturally elegant. Good separation of concerns. Unusable in practice. The round-trip latency made every tool call painful, and a typical workflow needs 15 to 20 of them. The migration back to local execution (which added 1,717 lines and removed 5,755) was one of the most impactful changes in the project. The lesson: for a desktop application with a rich in-memory data model, the agent needs to live where the data lives.
See It in Action
AI Agents in Action: a practical example of using AI in a web load testing app